

If you’ve been a reservoir engineer for any amount of time it’s likely you’ve interfaced with Landmark’s ARIES software in some way.
And if you’ve interfaced with ARIES, you’re aware of the myriad ways it can make your life difficult, hide things from you, display data that’s not complete, or otherwise mislead the user. It’s my go-to example for describing how user-hostile a software package can be.Luckily, new tools are available that make legacy software like ARIES more manageable without having to rip and replace your existing infrastructure.
Many ARIES power users skip the front-end GUI, preferring instead to go straight to the data and utilizing one of ARIES’s greatest strengths – the back end. By accessing the Access database or SQL server, you gain access to the power of this fully operational petroleum economics battle station… but there’s a catch. To visualize that data, other applications are required, most commonly spreadsheets to help graph ARIES data or compare this quarter’s reserves to last quarter. Updating them each time becomes a chore rife with opportunities for human error to creep in.
In the petroleum industry, business intelligence tools such as Spotfire, Tableau, and Power BI are making rapid inroads into workflows for processing and visualizing the unique sorts of data used in oil and gas. The good news for ARIES users is by connecting Power BI to an ARIES database, you can build automated QC checks that are more robust and update in real time as the database changes. In addition, you get control over appearance and formatting that persists through database updates and is suitable for use in presentations to executives or boards.
What does this really look like?
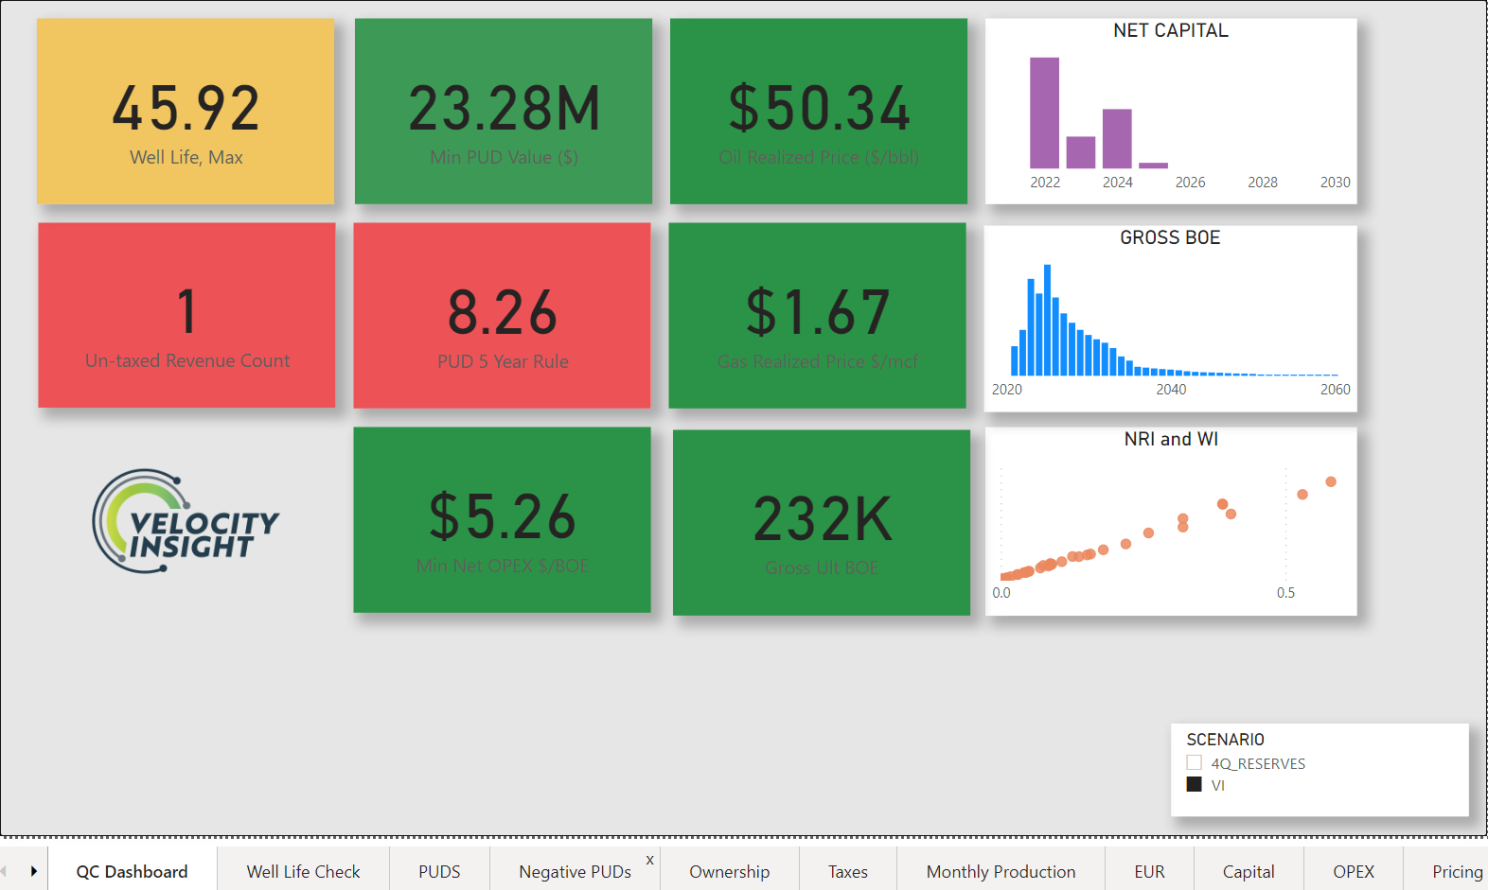
I’ve been working on a format for automating reserves database QC, a process that used to occupy a significant chunk of my time and mental bandwidth as reserves coordinator at several different companies. I haven’t implemented every check that I’ve ever thought of yet, but the tool is starting to take shape as a one-page stoplight format that gives me a quick overview of the run, plus several sub-pages with more detail on the outputs the dashboard highlights for further investigation.
Power BI’s Power Query Editor makes it easy to rename data streams (you may have memorized that C370 is gross oil, but what’s C1264?) and organize your data in a way that persists even if you switch databases. By leveraging ARIES’ strengths and using BI tools to fill in its weaknesses, you can better visualize your data and save time.
Yes, you could spend the time to develop this on your own, but VI is offering up this template for beta test soon so you don’t have to!
We’re in alpha testing with clients right now isolating bugs and working out kinks. If you’d like to be part of the beta or have questions on developing your own tool, drop me a line! I’d love to talk shop, learn how you’re using BI tools to improve your work, and help come up with solutions that work for you.