

Upstream O&G land data is a pain in the neck.
Acreage reports are built on a weekly, monthly, or quarterly basis and acreage numbers are constantly changing as companies buy and lease, and as leases expire. To make matters worse those acres can be counted as mineral acres, royalty acres, or leasehold acres and can be categorized by county, prospect, or drillblock.
If you have struggled with spreadsheets and pivot tables in this constantly changing landscape, business intelligence tools can make building reports easier.
Companies manage data in different ways and want customized reports based on company needs. Some companies rely on spreadsheets while others manage holdings with land specific software or an ERP. Regardless of the data management system, business intelligence tools can eliminate the filtering, parsing, and combining of separate spreadsheets by streamlining the reporting process. Tools like Tableau, Spotfire, or Power BI connect to data and can then be used for analysis and customized reporting.
I have been working in Power BI to automate some of these reporting processes. Customized dashboards replace cumbersome reports which cost companies time, bandwidth, and ultimately money. A report needs to be built once and then is able to be updated with each refresh of the data. If more information is needed, subpages can include detail down to the tract level and allow for that information to be securely shared easily.
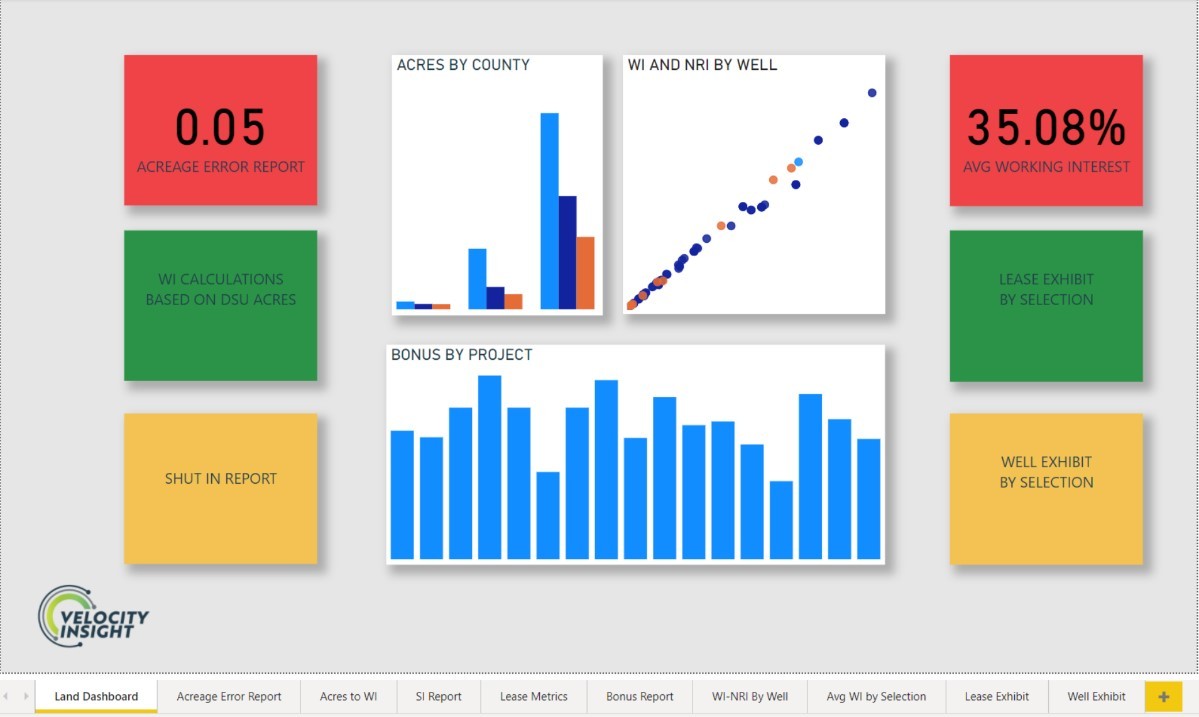
The Velocity Insight land dashboard template has launched on the Velocity Insight website (see it here), and incorporates hundreds of hours of development. While not every process, chart and visualization has been included, this is an example of how Power BI can help a company understand its holdings and activity immediately to make better decisions faster. Imagine how automated reporting could be flexed to meet your needs.
You could build similar functionality in Tableau, Spotfire, or any BI tool.
What’s important is the ability to create secure, refreshable database connections.
We think Power BI is a strong choice because it’s familiar to Excel users, but any modern BI tool is a big improvement over a spreadsheet.
Because spreadsheets can be inadvertently updated, retained for years or different versions can be routed, automated reporting processes with BI tools make reports that are accurate, secure, and faster. BI tools take reporting out of spreadsheets and pivot tables and into dashboards. If you love the look and feel of your spreadsheet or pivot table, Power BI can replicate this too! The best part is that BI tools connect to data which can be analyzed six ways from Sunday and the underlying data will remain unchanged.
In December, Velocity Insight hosted its first Power BI intro class for the corporate functions of Accounting and Land and will be hosting future classes in Dallas and Denver. We will talk through building some of these reports, but there are many possibilities and variations. Let me know whenever you have data questions. I’d love to hear what you are thinking, learn how you’re using BI tools, and help you come up with solutions that work for you.