Time series data in O&G is super common, has enormous potential value, and is (unfortunately) a huge pain in the neck.
We’ve been playing with some newer tools on the market (specifically, Seeq) and are seeing some promise for the first time.
So let’s walk through this – what are the pain points, where are the value propositions, and what do modern solutions look like? Skip to the end for a real example from some DJ Basin oil tanks, where we can see patterns that would be near-impossible with conventional tools.
Pain Points
SCADA, IoT, time-series data: call it what you want, but this group of data sources is really tough to deal with. There are a lot of pain points, but the three big ones that we’ve often seen people struggle with are:
- Difficult to query
- Large volume
- Asynchronous polling
Software tools optimized for time-series data usually use one of many back-end databases optimized for that type of data. These databases are really powerful and capable, but aren’t as easily queried as more-common relational databases like Microsoft SQL Server, Snowflake, or Oracle. Lots of people know SQL, but who knows how to write queries against CygNet or Mongo?
Large data volumes accrue because automated data collection at relatively high-frequency intervals adds up FAST. Most SCADA systems in the E&P space are configured for something like one- or five-minute intervals. Couple that with the massive cost decreases we’ve seen for SCADA devices and software, meaning that are huge numbers of devices on SCADA systems today. Rapid polling frequency multiplied by high device count means we get some very large datasets! Terabyte-scale datasets are common, and not much fun to deal with.
Another time series data analytics pain point is that with different device types, vendors, and networking configurations, the data that comes in from SCADA devices doesn’t line up in time. Not only do the defined polling intervals vary, but the actual timing of data coming in rarely lines up. Furthermore, remote well locations mean the communications sometimes fail, causing missing data. Whether the mismatch is in seconds or hours, you end up with data that looks like this:

Value Props
The value propositions for SCADA data are mostly in the engineering/operations realm. They center around optimizing production, reducing downtime, and reducing emissions. Let’s talk about a few examples!
Optimizing production has been a North Star of O&G data analytics for my entire career. A big part of why BI tools are so popular at E&P’s is that good visualization of production volumes and pressures is ENORMOUSLY helpful for finding opportunities to debottleneck facilities, tweak artificial lift, and open chokes. Most of that work gets done on daily (or even monthly!) data, but an ocean of high-frequency sits in SCADA systems, rarely touched.
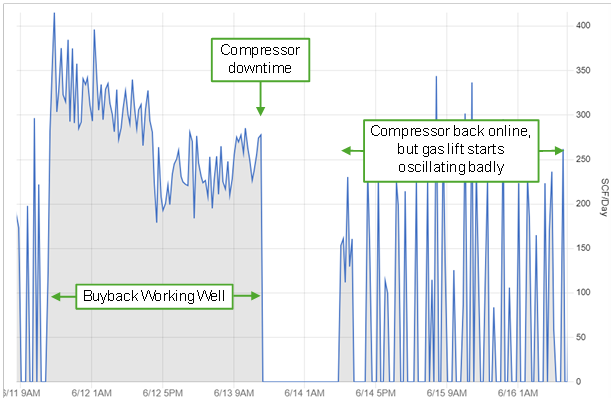
Bad behavior in well performance often gets hidden with daily data: there’s almost no way to diagnose failed plunger trips, stuck dump valves, or oscillating gas lift rates (aka “heading”). But one-minute data makes that easy to see, and sometimes sub-minute data is really useful for diagnosing artificial lift problems.
Reducing downtime often goes hand-in-hand with optimizing production. Knowing what wells are down (and why!) is certainly possible with low-frequency data, but the multi-day delay in most daily production allocation systems is a lost opportunity. SCADA data sources offer the opportunity to identify down wells from things like liquid loading or failed pumps within seconds, not days.

Historically, minimizing air emissions have been a secondary objective, and we expect that to remain the case. But the gap in focus between optimizing revenue and ensuring clean operations has gotten smaller, and we expect that to continue. Increased regulatory scrutiny at all levels of government means that being able to prove compliance is a real value proposition.
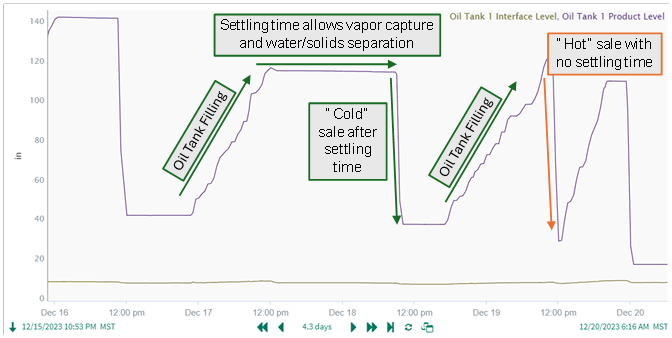
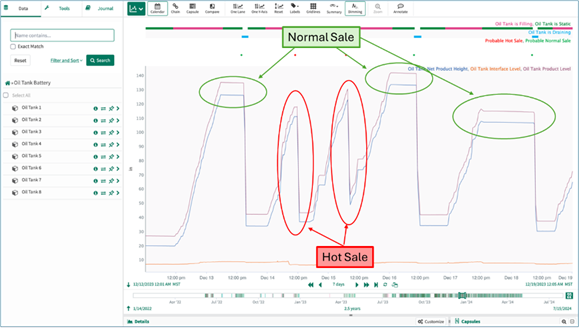
One particular use case is identifying identify “hot oil sale” instances in a live tank, which have negative financial and emissions repercussions. Hot oil sales occur when oil is drawn from a tank before the produced fluids cool, separate, and stabilize. These events increase emissions, cause rejected loads due to high RVP or BS&W, and present safety risks. It is best practice to allow oil to cool and finish separating before sale – but how would you identify that kind of thing just from daily data?

Paths out of the Pain
If there’s so much value and so many obstacles, what are the features we need in modern tools? A short laundry list:
- Rapid, user-friendly ingestion of SCADA data
- Organizing hierarchies from individual measurement points up through equipment, wells, and sites
- Integration with non-SCADA data like accounting, sales, or field tickets
- Cleansing tools to improve signal-to-noise ratio, align time zones, and perform corrections
- Derivates and integrals
- Low-code, GUI-based tools alongside custom Python coding
- Entity state identification (online/offline, filling/draining, etc.)
- Alarming and messaging
That’s a lot of nerdy stuff: bottom line, the good news is that we see a wave of new tools out there to handle these. While there are several E&P-specific solutions on the market, we’re fans of finding tools that serve multiple industries because they usually have lower costs and better capabilities.
Ben Nathan and I recently worked on a project using Seeq that gave us a glimpse into what’s possible. We were able do everything necessary to identify the “hot oil” sales events mentioned above: ingest, smooth, calculate derivatives, identify states, and build a dataset of historical “hot” (bad) vs. “cold” (good) sales. In the end, we saw that out of 1,100 sales tickets, this dataset had about 20% “hot sales”, where an oil hauler pulled oil straight out of a tank that was also being produced into. While not illegal, selling from a hot tank is definitely a bad practice, and that operator is now taking steps to educate their haulers on preventing this.

I’ve spent two decades playing with E&P data analytics tools: SAS, R, Spotfire, Power BI, and more Excel spreadsheets than fish in the sea. I’ve known about these kinds of events for years – they’re easy to spot visually in SCADA data. But this is the first time in my career I’ve seen modern, citizen-developer tools that can systemically analyze these events. I’m not sure which tools are going to win in this space yet, but I’m enormously optimistic that the future is bright.
If you’re fighting with time-series data, give us a call. There are some impressive solutions out there, don’t get left behind!


