
")
The beautiful part of business intelligence tools is that they automatically update as your database changes or as you change databases, so the time you spend getting this graph just right doesn’t have to be spent again for each new database or database update.
In my previous article I outlined several of the ways new business intelligence tools like Power BI, Spotfire, and Tableau make using legacy software like ARIES easier, faster, and more accurate. In this article, I wanted to present some examples of how to put that into practice and talk about the benefits of transforming your data to make it easier to work with. By spending some time up front and utilizing the functionality that business intelligence tools give you, you can implement new ideas more quickly and save yourself time.
I’ve primarily used Excel for automating QC in the past, usually by calculating a list of parameters and making them change colors using conditional formatting to highlight data. That approach can work in a smaller shop, but I never had any luck handing spreadsheets like that to a coworker to use. Updating your spreadsheet quarter to quarter generally involved copy-pasting Onelines, which inevitably break when a new column is added to the AC_ONELINE table or the source data changes in some other way. Then, with the ARIES Stream Reference open on one monitor and the QC spreadsheet and ARIES jockeying for position on the other, you’re ready to settle in and try to remember “What did this formula do?” and “What data was in column BV?”
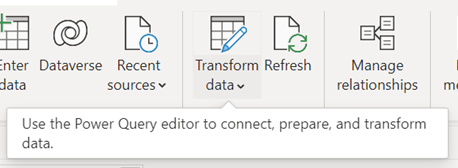
Power BI makes this process more repeatable by using Power Query for ETL, or Extract, Transform, & Load. ETL is a repeatable method for importing and formatting data that can be easily updated in the future, whether that’s from the nightly refresh of a production database or as you switch between databases to evaluate A&D targets. By referring to the data stream instead of a column number, changes to the underlying database are less likely to break your reports. As long as AC_ONELINE uses C370 for gross oil production, Power Query will find that stream and use it for the appropriate visualizations.
Once you have your data loaded, you can transform your data using Power Query Editor to make it easier to use. This step is especially useful for ARIES databases – the stream reference numbers make working with the back end data difficult without a lot of memorizing. I used a reference table and some code for this step because I use this workflow for multiple databases, but if you’re managing your own database you can simply type new names into the column headers. Power Query automatically writes code to transform your data based in your inputs.
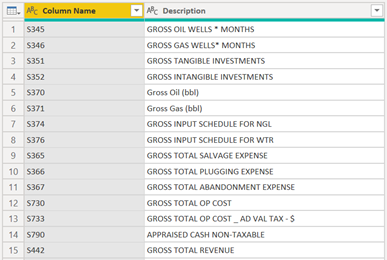
Changing the stream names upstream in the database makes them much easier to parse while building new visualizations and saves you the time of renaming all the streams once you’ve created your visualization. With the data tables linked and streams renamed to be more user friendly, creating new visualizations becomes almost as fast as the speed of thought.
In a recent conversation about ARIES database QC (I’m not the only one who likes talking to other folks about database QC, right?) the person I was talking to mentioned that they liked to look at a cumulative distribution of lease values to focus time and attention on their most valuable wells. I loved this idea, and because my data is already linked together and organized with plain language names, I was able to build the example below in about 15 minutes, including the time spent watching an 8-minute YouTube video on creating a cumulative distribution function in Power BI. It turns out in my data set 80% of the wells are valued less than $100K, and only 3 wells are worth more than $1MM NPV10, making up 40% of the value in this database. By coloring the data points by reserve category, it’s clear that the value here is concentrated in the PUDs.
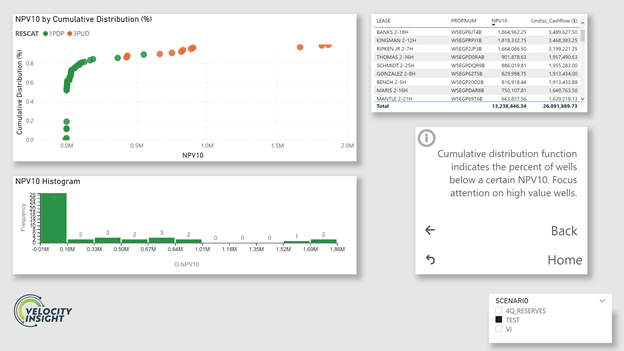
The beautiful part of business intelligence tools is that they automatically update as your database changes or as you change databases, so the time you spend getting this graph just right doesn’t have to be spent again for each new database or database update. Power BI allows you to make your QC checks more visual and interactive, facilitating communication between team members and making filtering and selecting data much faster. Want to know about an outlier? Click on it on the scatter plot and it will filter down to that well, giving you the name and propnum for further review in ARIES. Want to just look at your 2-mile laterals? There are built in filtering functions that make that easy too.
BI software like Power BI makes it easier than ever to build these sorts of tools yourself, but luckily you don’t have to!
Our team has been working diligently on improving our ARIES QC tool, and we’re ready to enter beta!
If you’d like to participate as a beta tester or you’d like to play with the current version of the tool, you can head over to this page to play with the Alpha version of our ARIES QC tool, book time to chat, or sign up for the Beta at a 75% discount. We’ll be improving the tool and adding functionality during the 8-week beta period, and all beta testers will receive the final version of the tool with improvements released in 1Q 2022.