In my 15 years of experience in the O&G industry, I have been deeply involved (most times acting as the middle-woman) in the intricate relationship between the Operations and Accounting departments.
While they may seem worlds apart, both rely on accurate spending data for their success. However, accessing and consolidating this data has always been a challenge!
In the past, I found myself struggling with multiple data sources and spending countless hours using Excel to generate the necessary reports. But fear not, because a game-changer has arrived: Business Intelligence (BI) tools, bringing a harmonious transformation to our data analysis process.
Smells Like: Data Overload
The O&G industry thrives on data, and finding the right information can be as challenging as sifting through your Case Logic CD Binder to locate your favorite album (if you’re a fellow Gen Xer or Millennial, you’ll get the reference, if not here is a visual)
As an Operational Accountant, I rely on data from sources like Bolo, OpenInvoice, WellView, and ProdView to create comprehensive reports that meet the entire organization’s needs. However, the manual process of combining data in Excel was a time-consuming endeavor and prone to errors.
Enter Business Intelligence (BI), the rockstar solution for data analysis
BI tools like Power BI and Spotfire have revolutionized the way we handle data in the O&G industry.
They provide a centralized platform to integrate, analyze, and visualize data from multiple sources, eliminating the need for spreadsheet acrobatics (even though I still love pivot tables).
One of the biggest advantages of these tools is its ability to foster collaboration across departments. Operations and Accounting can now work hand in hand, leveraging the same data and sharing insights in real time. This collaborative approach strengthens the organization as a whole, aligns goals, and leads to better decision-making.
You Oughta Know: Data QC
Now that you have all your valuable data centralized, it’s time to take the next step. D&C spend plays a crucial role in the organization, and as an Operational Accountant, I understand the importance of accurate and reliable data for the monthly accrual process (cue the eye roll from the Ops team).
While accruals may not be the most exciting task, they are essential for better financial reporting, informed decision-making, and transparency in your company’s financial operations.
But let’s move on from the accounting lesson. During the accrual process, I often find myself diving into the intricate details of spend data, only to encounter a multitude of inconsistencies that add significant time and complexity to the process. And it doesn’t stop there; these inaccuracies have far-reaching consequences, impacting:
- Budgeting
- Future Planning
- Partner Audits
- Overall Financial Results
Introducing CapEx Data QC!

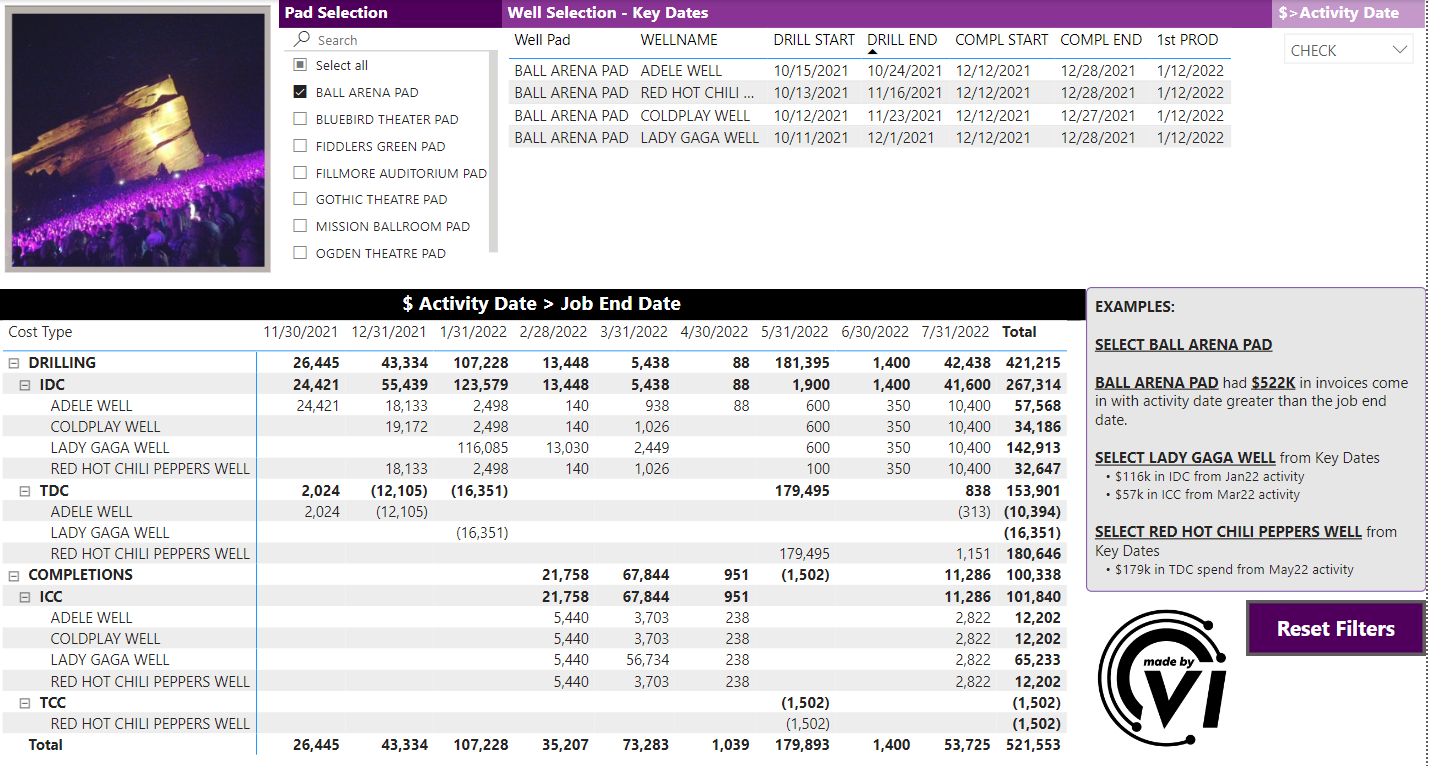
This powerful tool provides you with a comprehensive snapshot of D&C spend, categorized by Pad>Well>Vendor, and allows you to QC your data at the same time!
- Brings to light any coding inconsistencies
- Alerts you if costs are outside the expected activity range
- Even assists in detecting any missing invoices
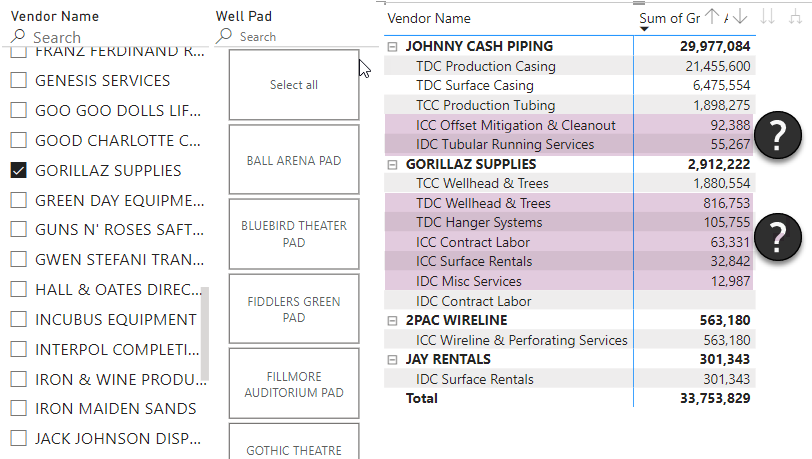
Missing Invoices or Coding Issues?
 surface casing and production tubing coded to incorrect accounts can make accruals messy
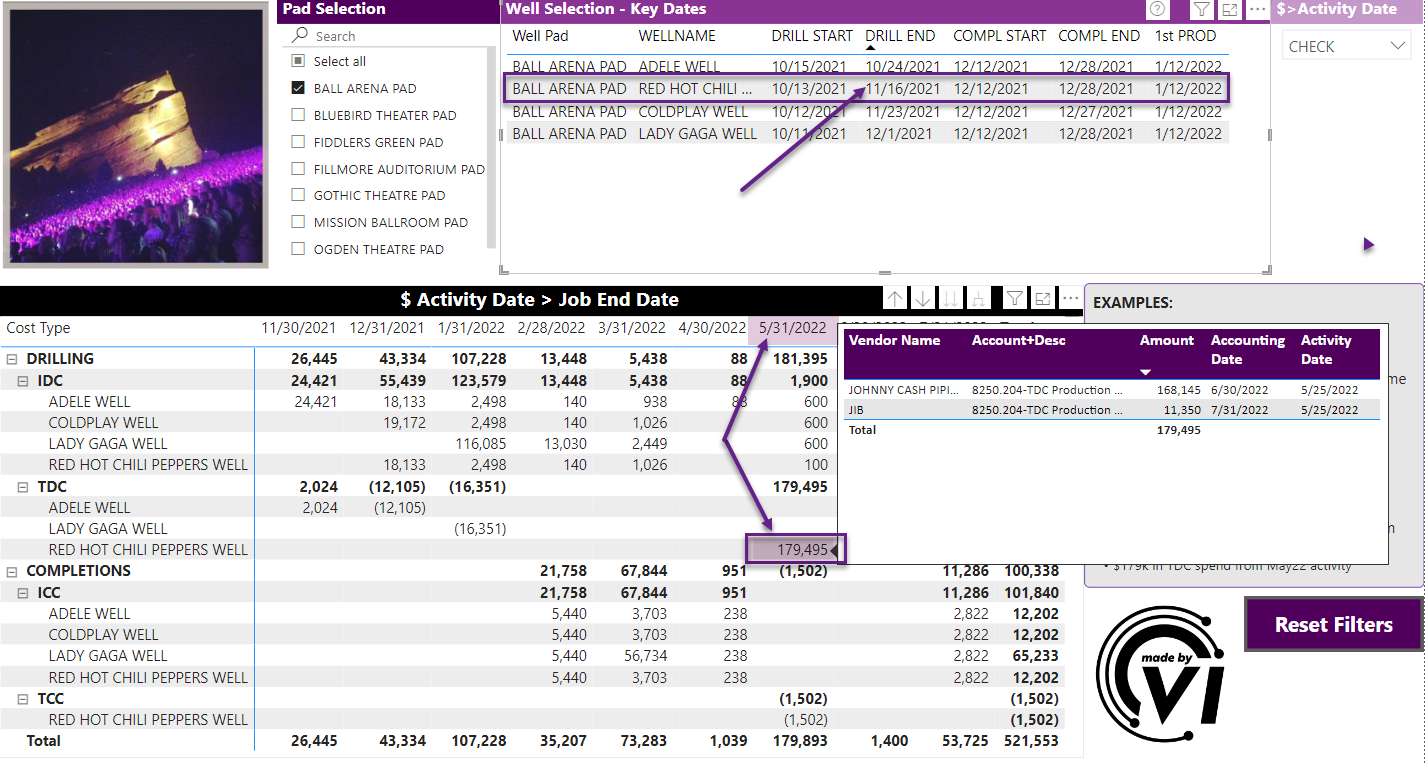
Costs Coming in After Expected Activity?
 production casing invoice with a May 2022 activity date being coded to a well that RR November 2021?!?!?!
Inconsistent Coding Amongst Vendors?

Originally designed with the Operational Accountant in mind (sorry we can be very tabular) Velocity Insight understands that every organization has unique requirements. That’s why we offer the flexibility to add additional data points (Like AFE, field estimates, LOE analysis) or visualizations to tailor department needs.

